Go to TradingComputers.com
Trading Support and Resistance
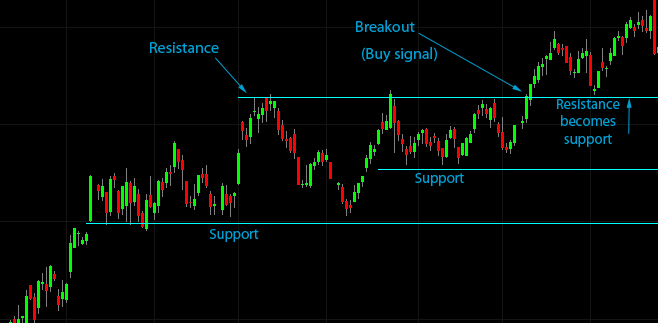
Support is a price level where buying interest is sufficiently strong to overcome selling pressure. As a result, a decline is frequently halted and prices turn back up again. Resistance is the opposite of support.
The Federal Reserve Bank of New York studied support and resistance effects on the foreign exchange markets and concluded that support and resistance levels are able to predict trend interruptions. The report also stated that more than 90 percent of professional foreign exchange traders use support and resistance as either a primary or secondary source of trading signals.
I have talked to traders in the open outcry pits of Chicago and they all seemed to be using support and resistance to trade commodities and stock index futures. I have used it for more than a decade in trading and have concluded that it is almost impossible to consistently beat the performance of the S&P 500 without using support and resistance as an important element in my trading decisions.
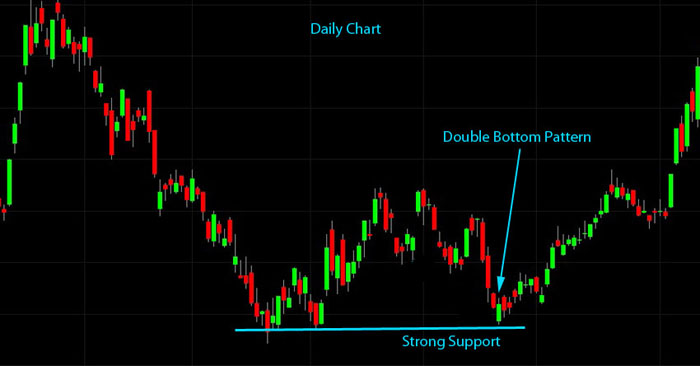
Support and Resistance is usually a key component in constructing price patters, such as the double top and double bottom.
Support and resistance can be found by inspecting charts, using Floor Trader Pivot levels (more on that in a future article), Fibonacci levels, moving averages, and trend lines. There are some more controversial methods like Square of Nine and Market Profile.
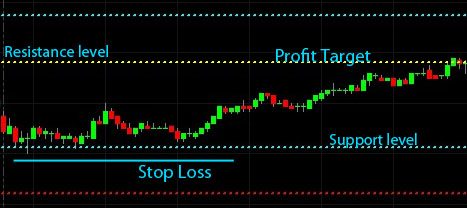
I like to enter a trade when the price is just above support. If the price action falls back down below that support level then I exit. My profit targets are also based on support and resistance. I will discuss more on exits and profit targets in a later article.
When using moving averages you need to use the ones that everyone else is using. The key moving averages are not magic; it's just that since so many big market players use them, they take on a high degree of effectiveness. The key moving averages to use are the 50 day, 100 day, 150 day, and 200 day moving averages. Some people also use 50/100/150/200 week moving averages.
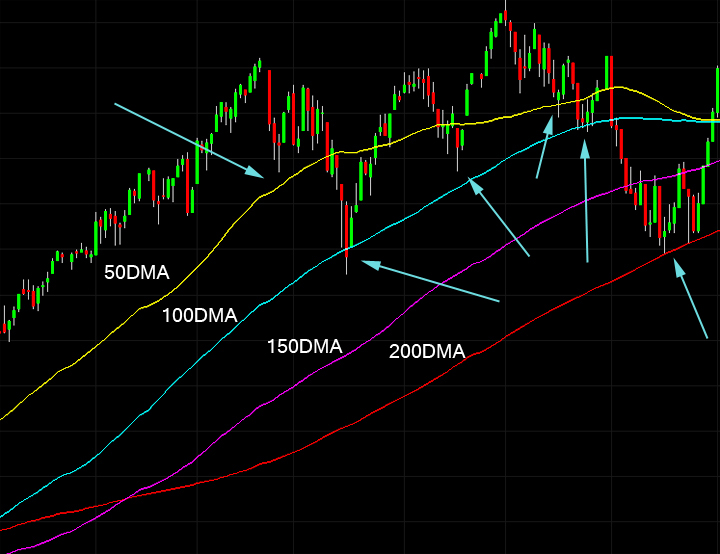
The above chart of the S&P 500 index shows the supportive effect of the moving averages.
The placement of Fibonacci levels is somewhat subjective but they are still very useful when observing a pullback. A retracement that is only 23.6% quite bullish, a 38.2% is fairly bullish, 50% or more is cause for concern. You can use the 23.6% and 38.2% retracement areas as a place to start looking at building a position as a pullback entry once there is reasonable evidence that the market might be resuming the original trend.
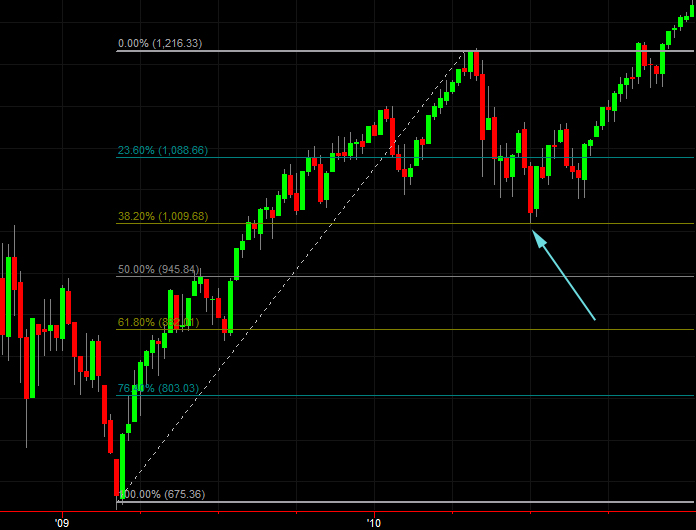
The above example is a weekly chart of the SP500 showing a perfect 38.2% retracement. This was your re-entry point to buy back into the market.
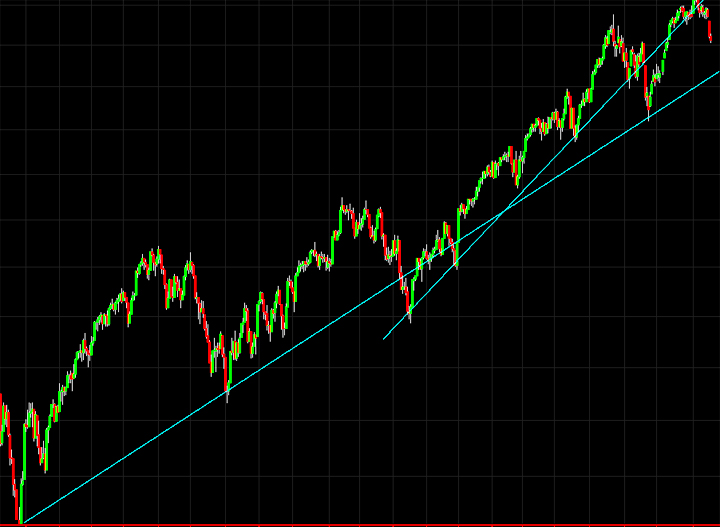
A trend line is helpful but if it is broken it often means that the trend is over or a longer pause is needed rather than that it is completely reversing the other way. When a trend line is touched, it is often a good time to look for a re-entry opportunity.
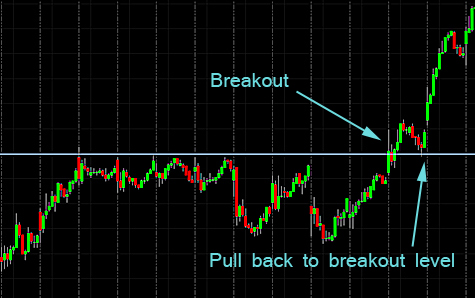
A breakout above resistance is bullish but frequently the price will pull back to the breakout point, which has now transformed from being resistance to being support. This pull back to the breakout level is a great trade entry point, or a great place to add to a position.
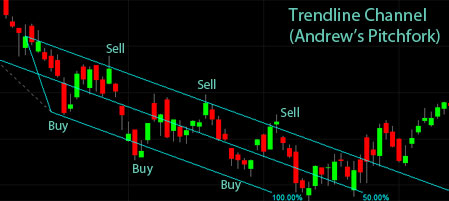
A variation of the trend line is the channel. When channels occur they are easy trading from both the long and short side. Andrew's Pitchfork is a tool that helps you quickly draw channels.
